US-Sport
MLB: Sabermetrics in Baseball: WAR – What is it good for?
Since “Moneyball” at the latest, people in Germany know how important statistical data are in baseball. Sabermetrics, the extended statistics in baseball, form the basis for the analytical evaluation of sport. SPOX provides insight into the most important statistics and explains their beginnings.
No sport is as statistical as baseball. Not least thanks to “Moneyball” these have become socially acceptable and shape the image of the scene. Moreover, no other fantasy sport is as popular as fantasy baseball, at least in the USA. The reason is obvious: no other sport has such detailed statistics to create the most objective gaming experience possible.
But the statistics are not only there to make the game more vivid or to make fantasy players happy. Statistical data has been used to evaluate players for almost 30 years. And on a completely objective basis – in contrast to traditional scouting, which is highly subjective.
Baseball has always had statistics such as the strike average for Hitter or the Earned Run Average for Pitcher. In the second half of the 19th century, the boxing score was invented, a table that clearly shows the most important statistics for each player, so that every reader could follow to some extent how a game went.
Almost 100 years later, however, it was occasionally realised that these values in themselves did not say much. Engineer Earnshaw Cook, a Princeton graduate, is considered one of the first to collect data beyond the standard statistics. He published his findings in his book “Percentage Baseball” (1964), which, however, met with fierce opposition in the national media as well as from officials and coaches.
They didn’t want anything to do with this new-fangled hokum. In 1971, the Society for American Baseball Research, or SABR, was finally founded. One of the founding fathers was the journalist Bill James, who published the first edition of his annual “Baseball Abstracts” in 1977 and made the so-called “Sabermetrics” more popular.
But what are these sabermetrics? They are basically a collective term for higher-quality statistics in baseball. The interesting thing is that to this day more and more statistics are being added that provide more or less meaningful perspectives on sport.
In the matter of batting, the batting average was initially revealed to be insufficient. It is calculated using the formula: Hits divided by at-bats. This means: If a hitter creates three hits in ten At-Bats, then the strike average is .300! And that’s very good.
The problem is, however, that the impact average says absolutely nothing about the other ways to reach the first base. It can also reach first base by walk or hit-by-pitch, but will not change its stroke average. As far as player evaluation is concerned, this alone is a dead end.
The Moneyball principle made respectable by Billy Beane at Oakland A’s is based on the fact that a player’s value is measured by his ultimate contribution to his team’s run difference. How does he help his team to make or prevent runs? The average impact helps here only to a very limited extent.
In trivial terms: To get a run, you have to get on base first. Only there is a chance of getting a run. Beane once called Kevin Youkilis the “Greek God of Walks”. Rightly so: He had an on-base percentage of .382 in his career, which only 154 of the more than 18,000 players in MLB history have surpassed.
And this OBP is also one of the best-known Sabermetrics statistics of our time. It contains not only hits, but also walks and hits-by-pitch, which are shared by the plate appliances. And it says how often a hitter reaches at least the first base.
Another important aspect in the individual evaluation of a hitter is the Slugging Percentage, because this focuses on the quality of the hits. Whether someone beats a monster Homun a la Aaron Judge or just makes a single through the middle is the same according to the punch average! Both are hits on balance.
The Slugging Percentage, however, tells us how high the quality of the hits is, i.e. how many bases the battery usually crosses per beat. The formula here is: Total Bases by At-Bats. A single is one base, a double two, triple three and the home run counts four bases.
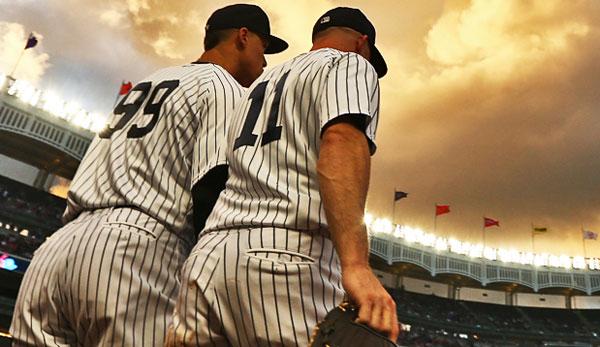
A current example in this respect is a small comparison between Yankees-Outfielder Aaron Judge and Royals-First-Baseman Eric Hosmer. Both beat (status: 26.7.17) .310, which concerns the impact average. But for the Slugging Percentage, Judge is .646, Hosmer is only .488, so Judge is the more productive player. The main reason for the difference are Judge’s more than twice as final home runs (32 versus 15).
But since you like to look at one value instead of several, On-Base plus Slugging, OPS for short, was introduced, which is simply the sum of OBP and SLG. If we stick to the current example, Judge here is 1.081, Hosmer is only .857 – in terms of OBP, Judge is .434, Hosmer is .369.
Judge also comes to Base much more often, which is because he leads the league in Walks and has twice as many as Hosmer (72 – 36). Judge is the better player from an analytical point of view, because he is more offensively productive than Hosmer.
Then, of course, there are numbers like Runs Batted In and the like, but those depend on other players. No one gets on the base before you do, the chances of getting an RBI are slimming. For this there are stats like “Runs Created”, in which roughly speaking everything a player can do on his own to achieve a run is played in. So come on base, steal bases, hit runs home, and so on.
On the pitching side, ERA was the go-to statistic for years. The earned runs are divided by the pitched innings and the score is multiplied by nine – a complete game goes nine innings. You already have the ERA, which says how many runs a pitcher allows on average per game.
Sabermetricians, as they are called, criticize, however, that this value does not take into account whether a pitcher himself is the cause of an opposing hit or rather his fellow players. A really good shortstop is more like a sharp ground ball than a middle class shortstop.
Defense Independent Pitching Statistics were introduced for this purpose. Voros McCracken developed this system in 1999 to measure only the performance of a pitcher. However, these statistics require higher mathematics and are difficult to explain. One of the best known values in this respect is Fielding Independent Pitching (FIP).
Baseball Prospectus, in turn, relies on the Peripheral ERA, which looks at hits, walks, home runs and strikeouts and takes into account an Adjusted Ballpark Factor, since baseball stadiums all have different dimensions and peculiarities. Some ballparks are designed for hitters, others are paradises for pitcher.
Compare the “shooting range” Great American Ball Park in Cincinnati with the gigantic Petco Park in San Diego. A pitcher based on classic statistics will look better in San Diego than in Cincy. But this comparison is by no means fair.
Also popular is the BABIP, the Batting Average on Balls in Play. The formula for this is quite trivial. Hits Minus Homeruns are divided by At-Bats Minus Hits Minus Homeruns Plus Sacrifice Flys. The question here is, how many balls against a pitcher that are brought into play also become hits? Conversely, of course, these statistics are also available for Hitter.
However, BABIP based on probability calculation is not considered to be a useful basis for evaluating the quality of a pitcher or hitter. It is assumed that if a player has a relatively high BABIP in one year, it is likely to do worse the following year. In contrast, someone with a poorer BABIP should be more successful in the following year. This value is usually balanced over a longer period of time.
If you want to measure the value of a player in general, you use VORP or WAR, the Value over Replacement Player or the Wins Above Replacement.
VORP indicates how much a player contributes to his team compared to a fictitious substitute who acts below average. And WAR in turn works similarly and describes how much more wins the player has provided for his team compared to the fictitious backup.
WAR values, however, vary from position to position and are based on a player’s successful performance and playing time. However, different portals calculate these statistics differently, since they do not all use identical variables. Baseball reference will provide different values than FanGraphs, for example.
Jose Altuve, who currently leads the American League in WAR, has a score of 5.5 in FanGraphs and 5.9 in Baseball Reference, but both agree that no AL player is currently more valuable to his team than the Second Baseman for the Houston Astros.
Statistics are becoming more and more important nowadays, especially in the field of scouting. Although the subjective observation of a player by experienced scouts has always worked and is still an important aspect of player acquisition in professional baseball, nowadays you have to fall back on analytics. This is because objective figures cannot be ignored.
This was also underlined by Billy Beane in an exclusive interview with SPOX: “If you don’t use this data and don’t take advantage of your access to information, you lose the connection. And Sabermetrics, which were once only meant to better illustrate sport to the general public and to improve fantasy games, are the best source for these data.
Sabermetrics may not be necessary for the ordinary fan to easily understand the game. But if you’re more serious about baseball, you can’t avoid paying attention to this data these days.


You must be logged in to post a comment Login